Vegetation Condition Index (VCI)
The Vegetation Condition Index (VCI) compares the current NDVI to range of values observed in the same period in previous years. The VCI is expressed in % and gives an idea where the observed value is situated between the extreme values (minimum and maximum) in previous years. Lower and higher values indicate bad and good vegetation state conditions, respectively. VCI varies from 0 for extremely unfavorable conditions, to 100 for optimal. Formula : VCI = 100 * (NDVI - NDVI min) / (NDVI max - NDVI min) (Kogan, 1990) NDVI max and NDVI min are multiple year maximum NDVI and minimum NDVI for a pixel with reference to a specific climatology.
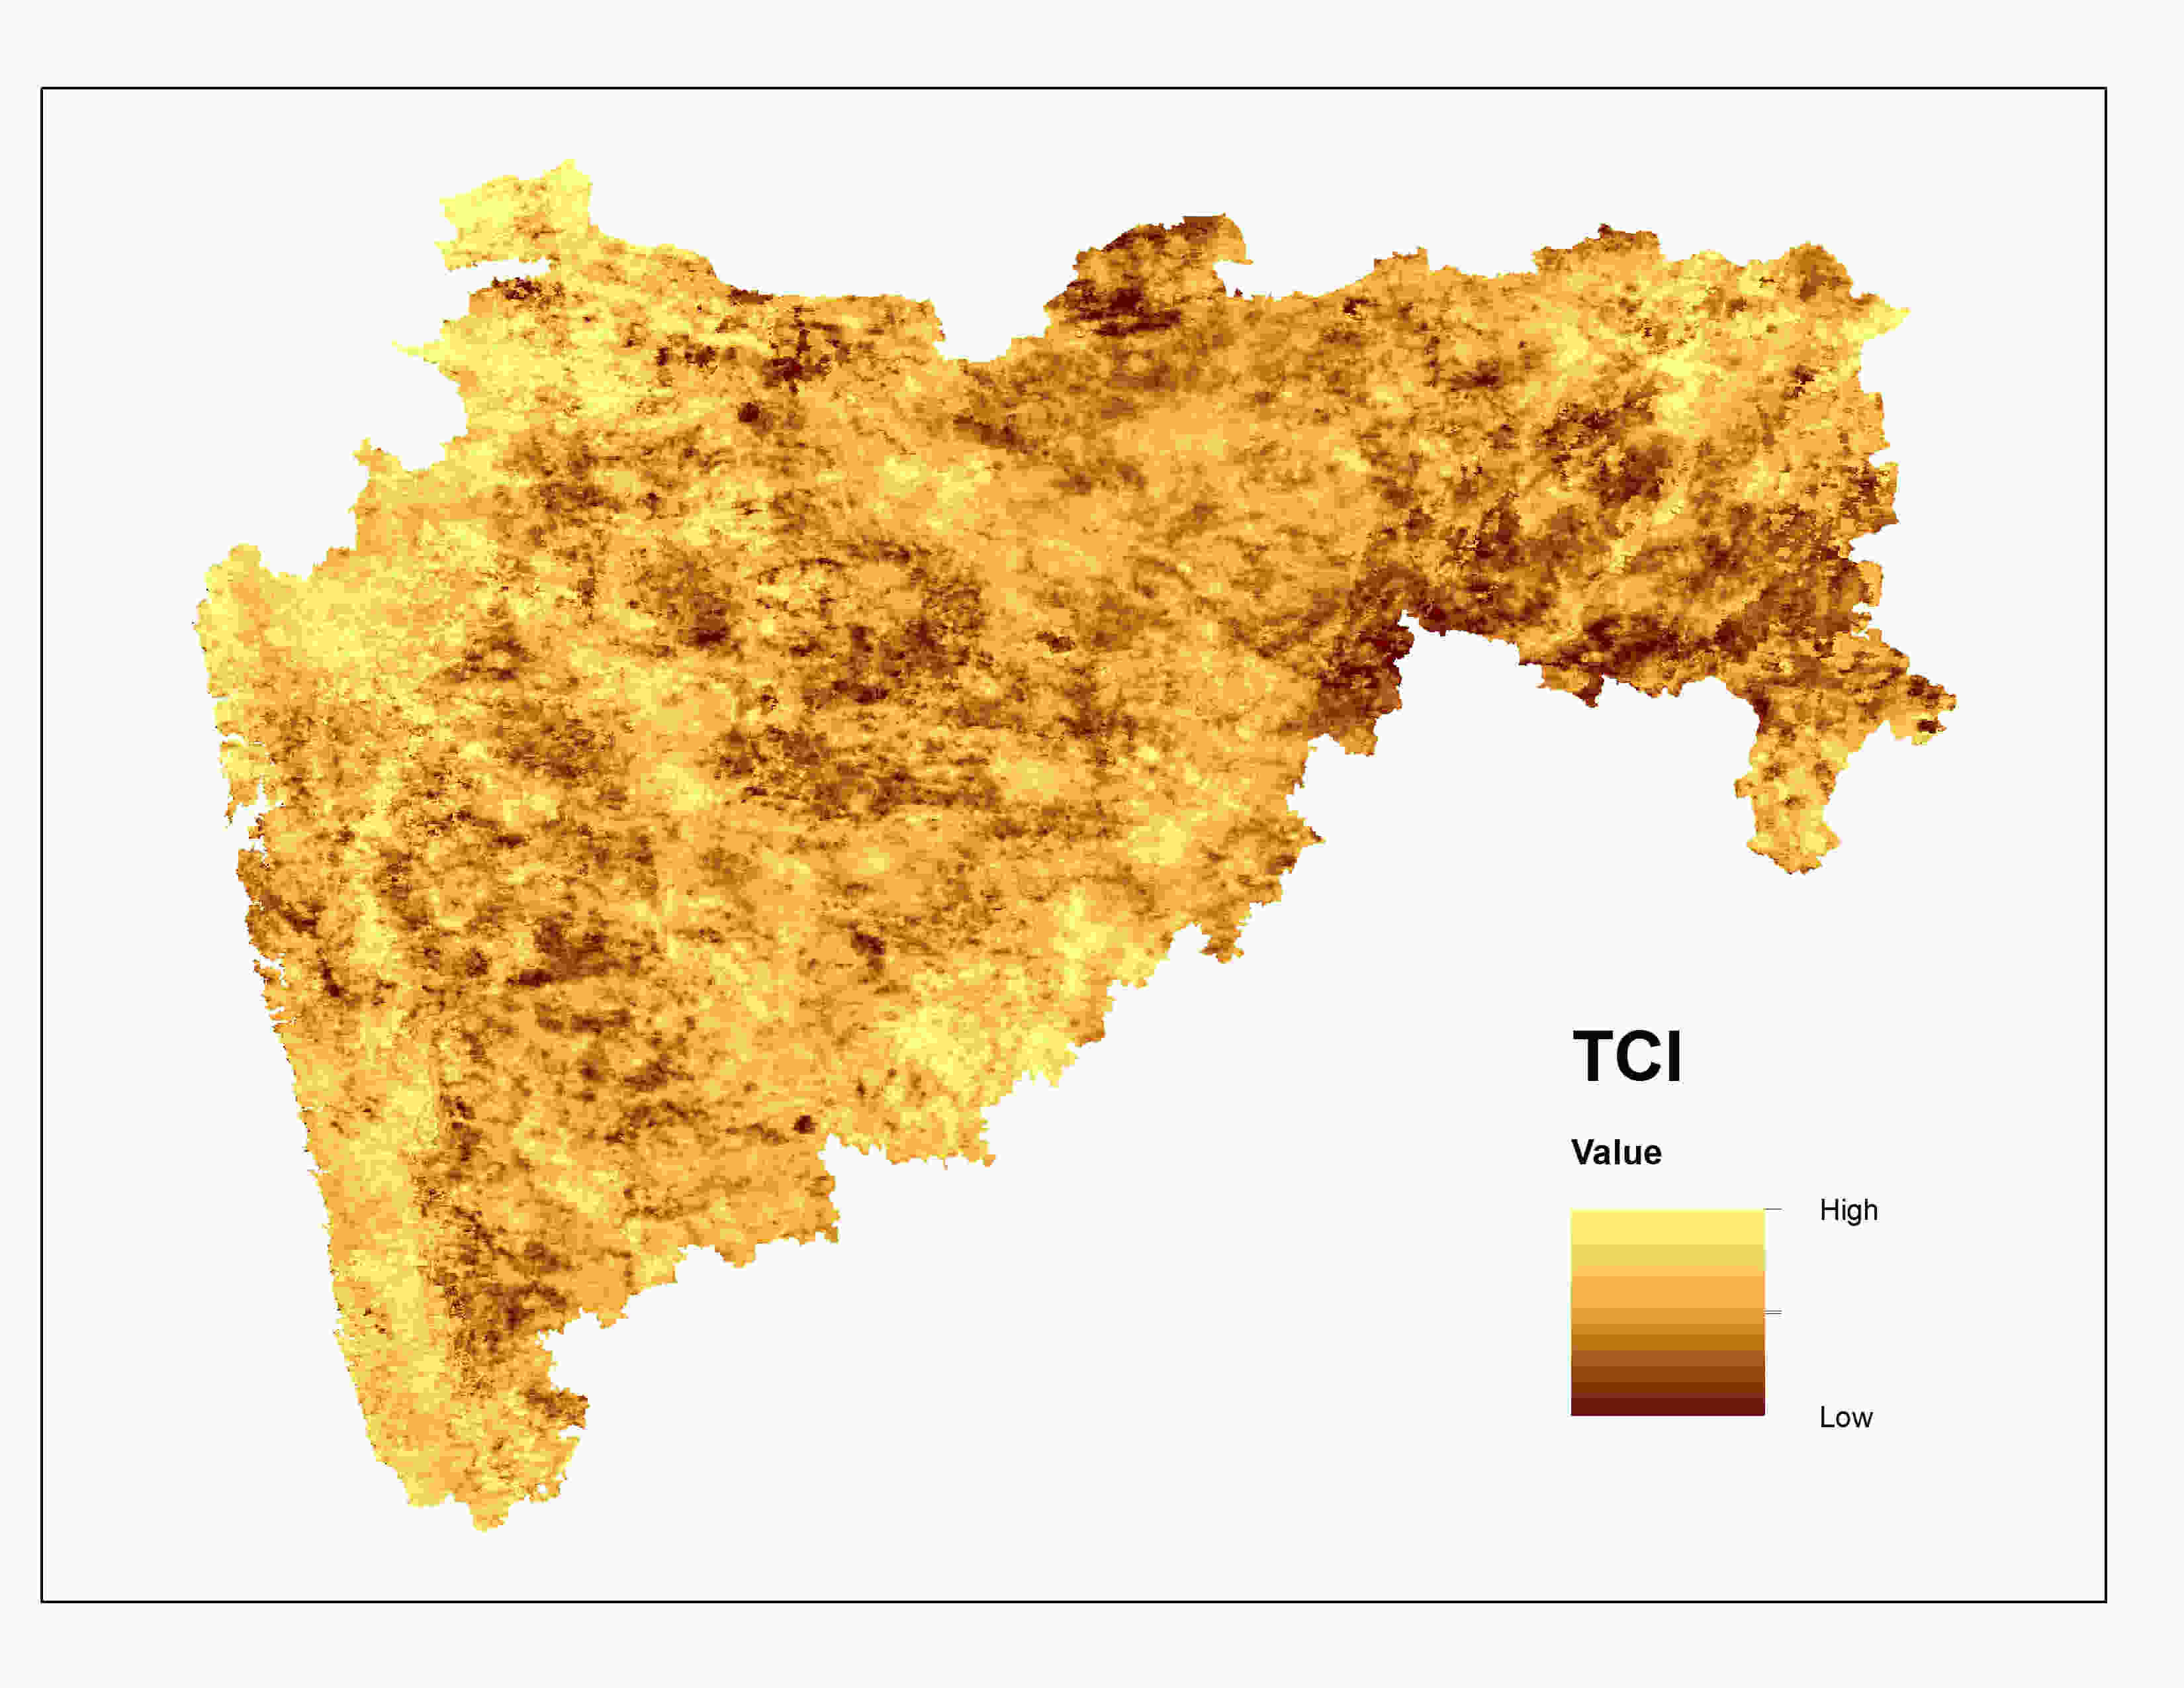
Temperature Condition Index (TCI)
TCI is used to determine stress on vegetation caused by temperatures and excessive wetness. Conditions are estimated relative to the maximum and minimum temperatures and modified to reflect different vegetation responses to temperature. TCI varies from 0, for extremely unfavorable conditions to 100 for optimal conditions. TCI was developed based on LST observation from TIR remote sensing. Formula : TCI = 100 * (BTmax - BT) / (BTmax – BTmin) (Kogan, 1995) The weekly thermal brightness temperature is termed as BT BT is calculated from every week’s satellite data of around 17 years i.e. from 2002 to current. BT max and BT min are termed as multiple year maximum and minimum, pixel specific thermal brightness temperaturePrecipitation Condition Index (PCI)
PCI ranges from 0 to 100 corresponding to changes in precipitation from extremely unfavorable to optimal. In case of a meteorological drought which has an extremely low precipitation, the PCI is close or equal to 0, and at flooding conditions, the PCI is close to 100 Formula : PCI = 100 * (TRMM - TRMM min ) / (TRMM max - TRMM min) (Lingtong Du et al.) TRMM max and TRMM min are multiple year maximum TRMM and minimum TRMM for a pixel.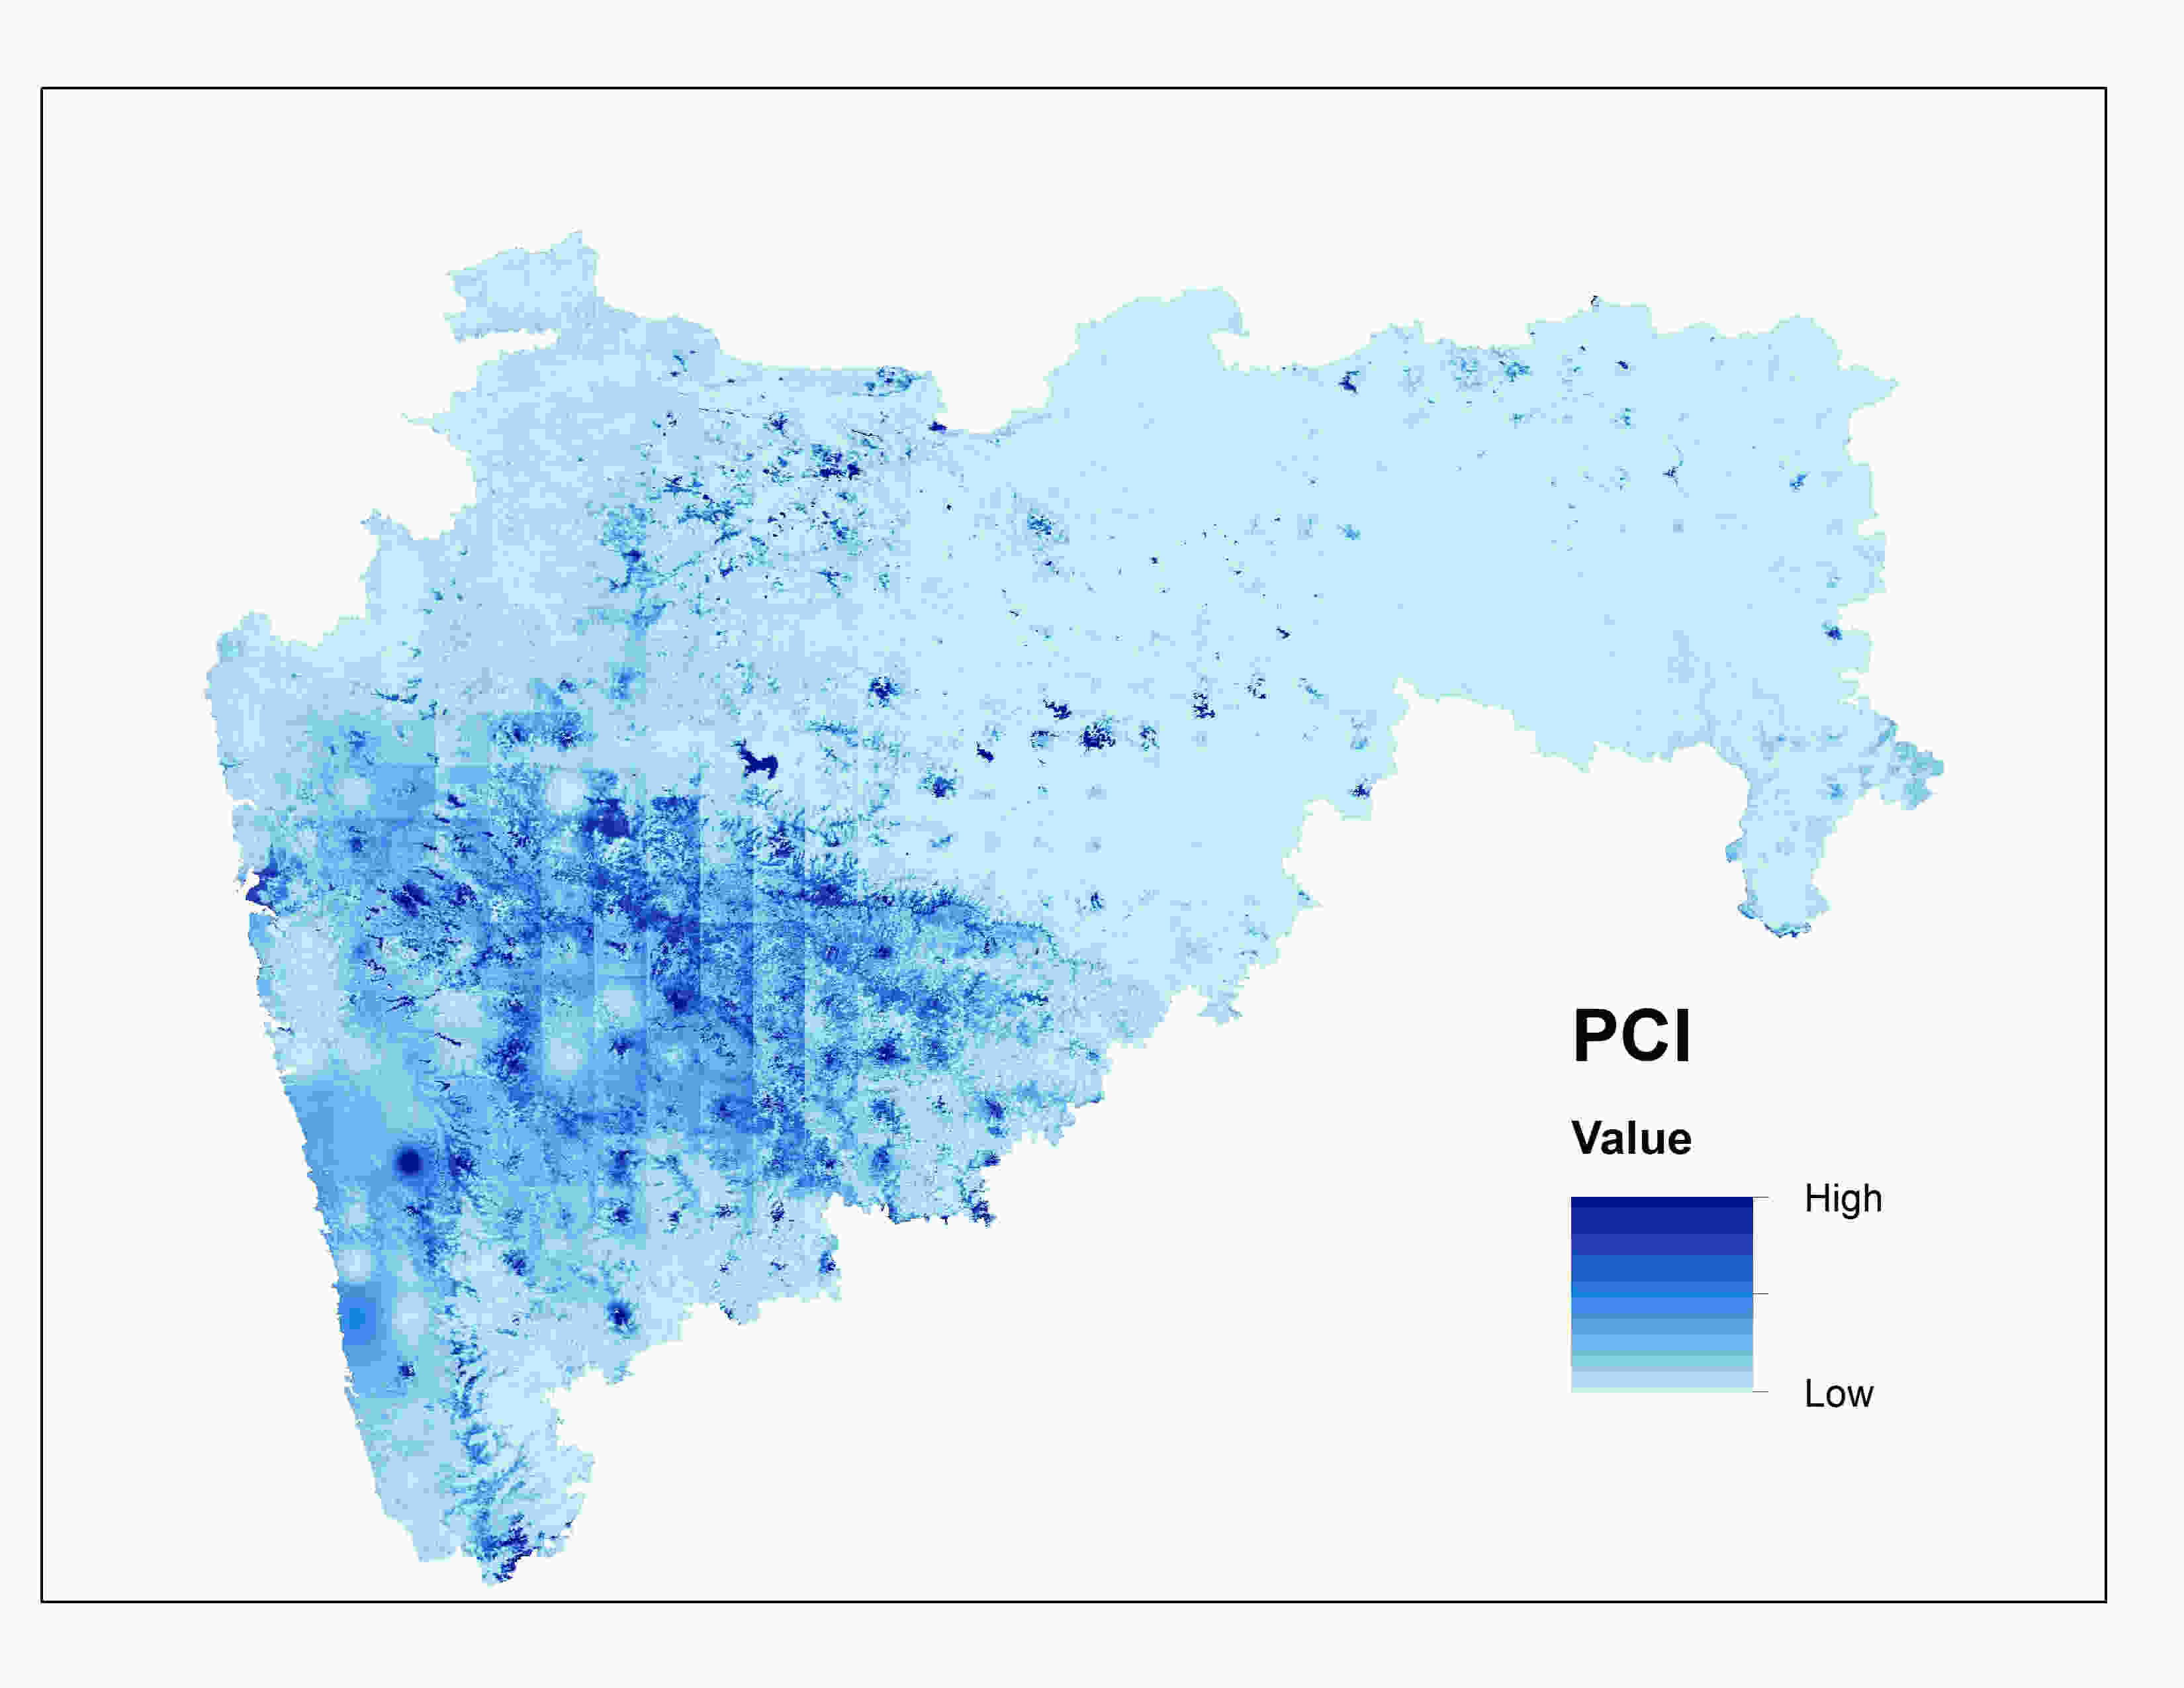
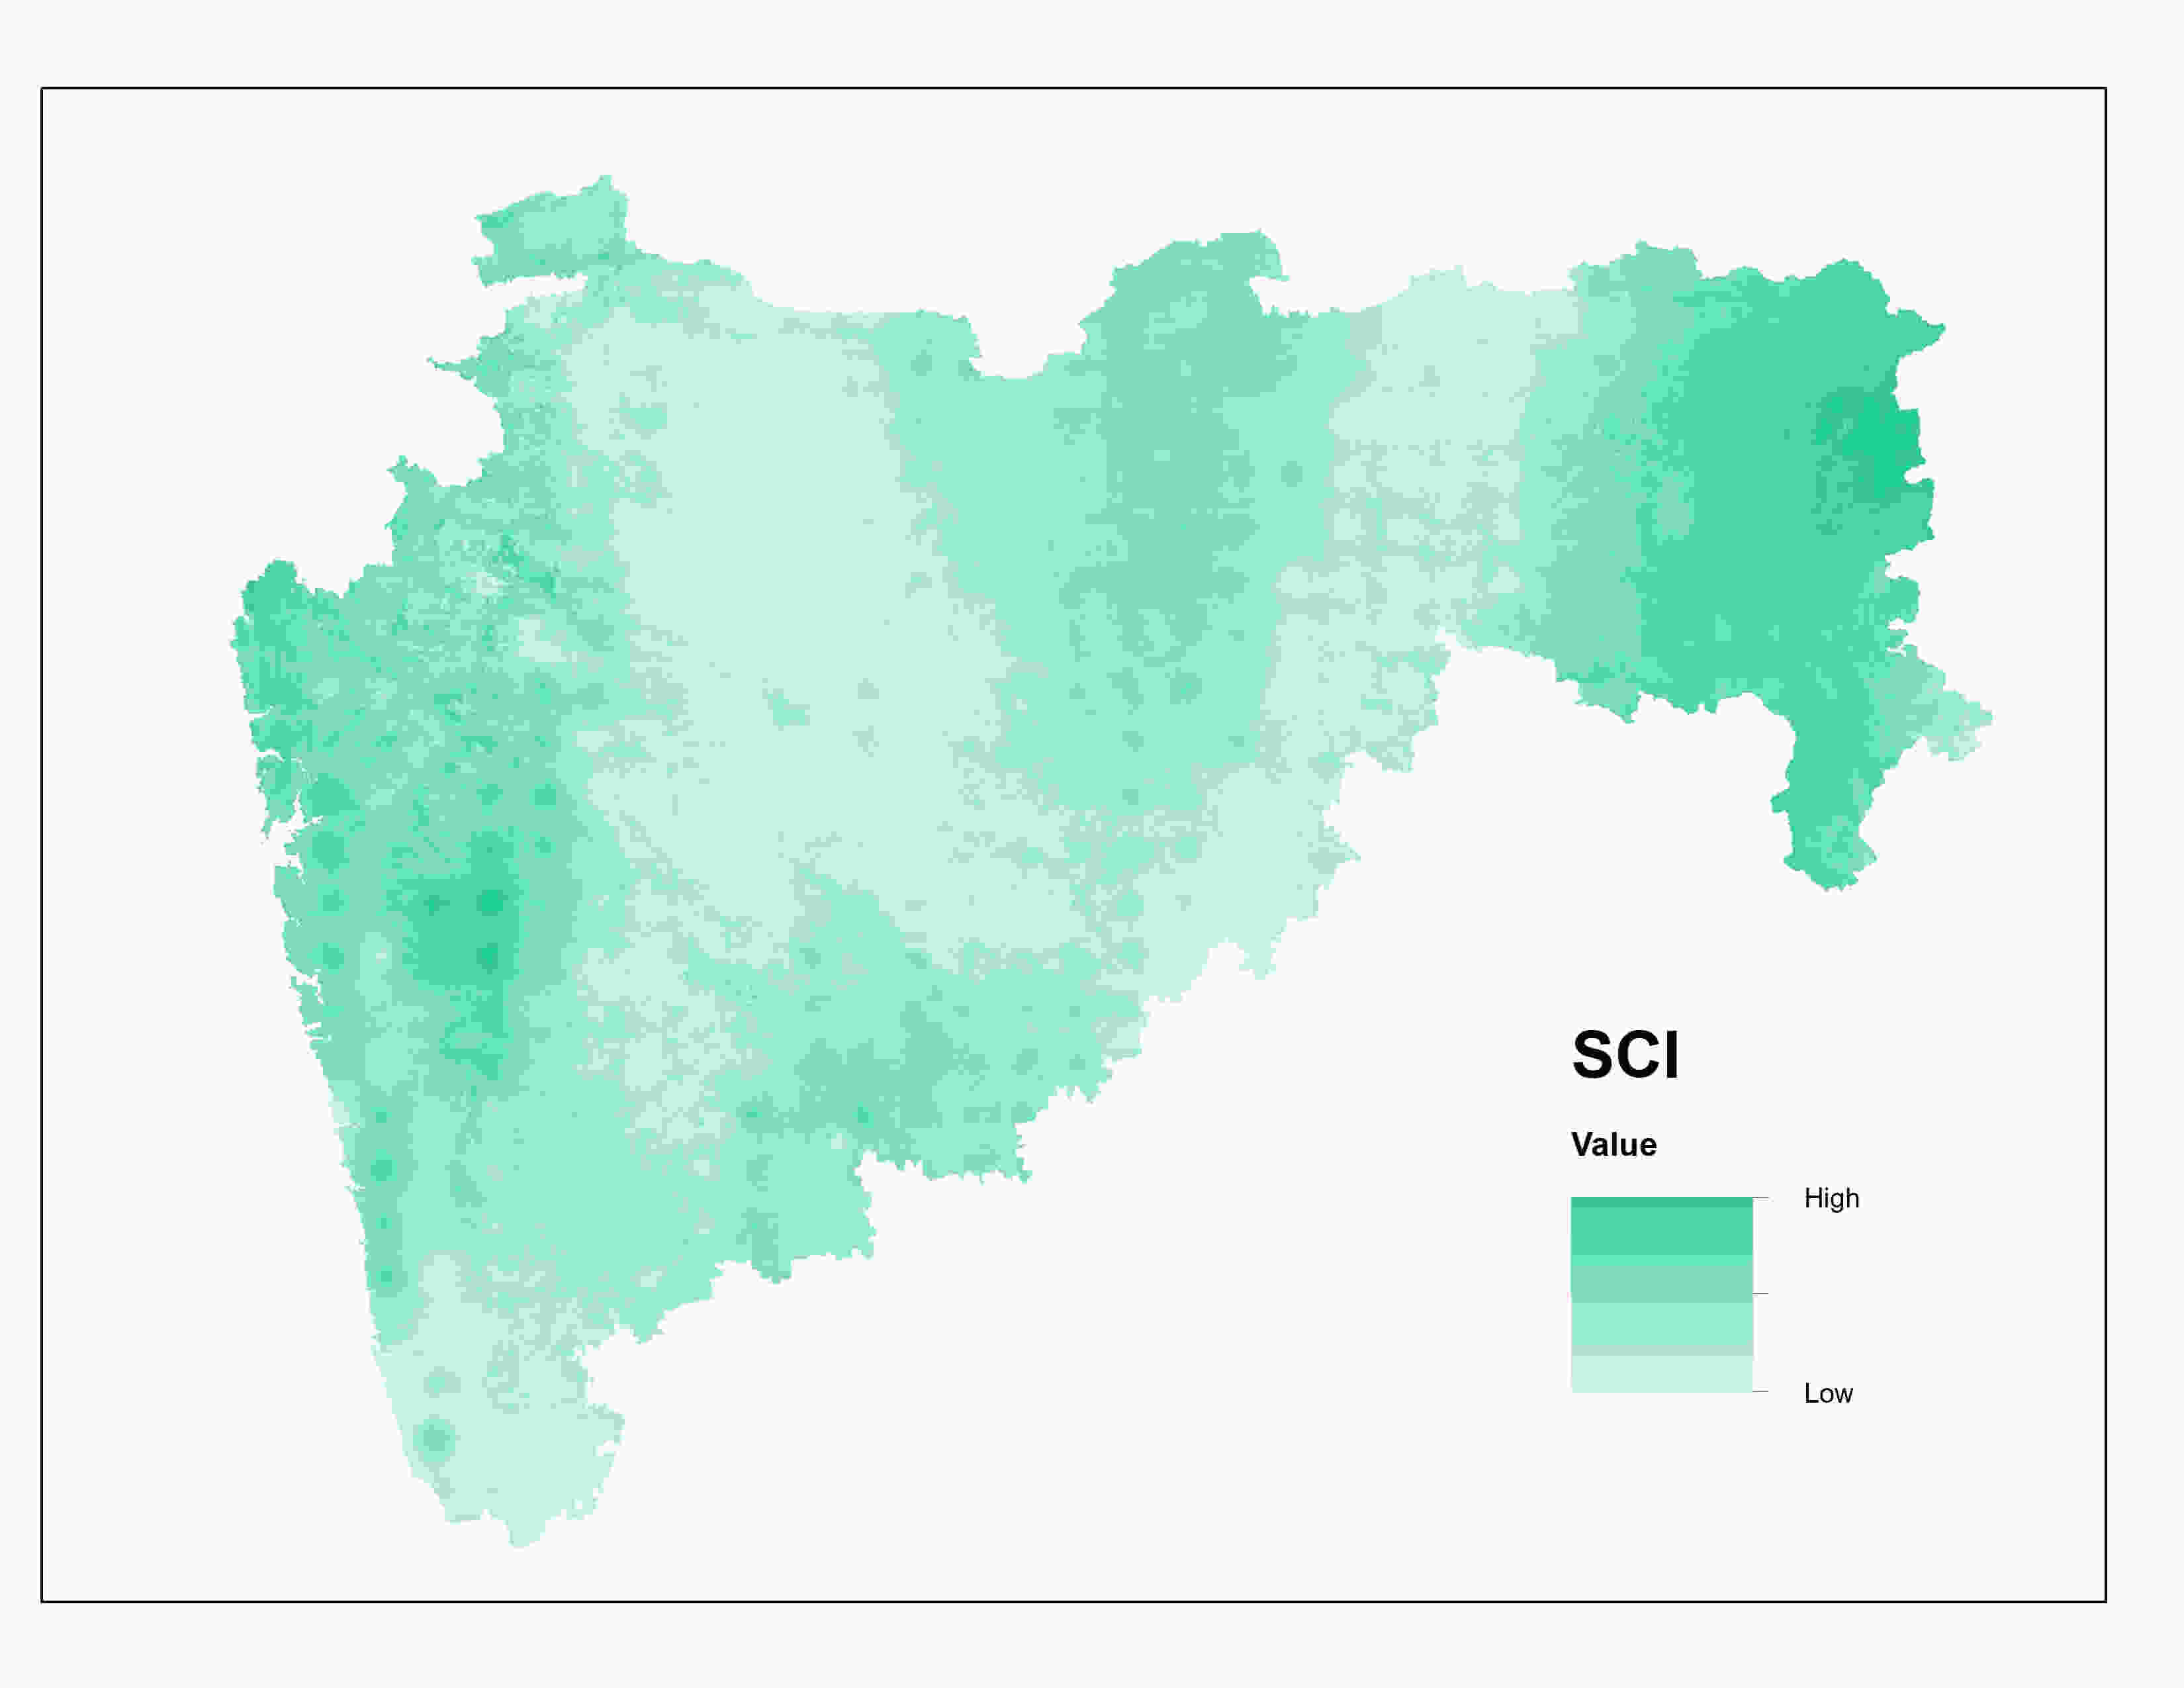
Soil Condition Index (SCI)
SCI ranges from 0 to 100 corresponding to changes in soil moisture from extremely unfavorable to optimal. In case of a meteorological drought which has an extremely low soil moisture, the SCI is close or equal to 0, and at moisture saturation conditions, the PCI is close to 100 Formula : SCI = 100 * (SM - SM min ) / (SM max - SM min) SM max and SM min are multiple year maximum soil moisture and minimum soil moisture for a pixel.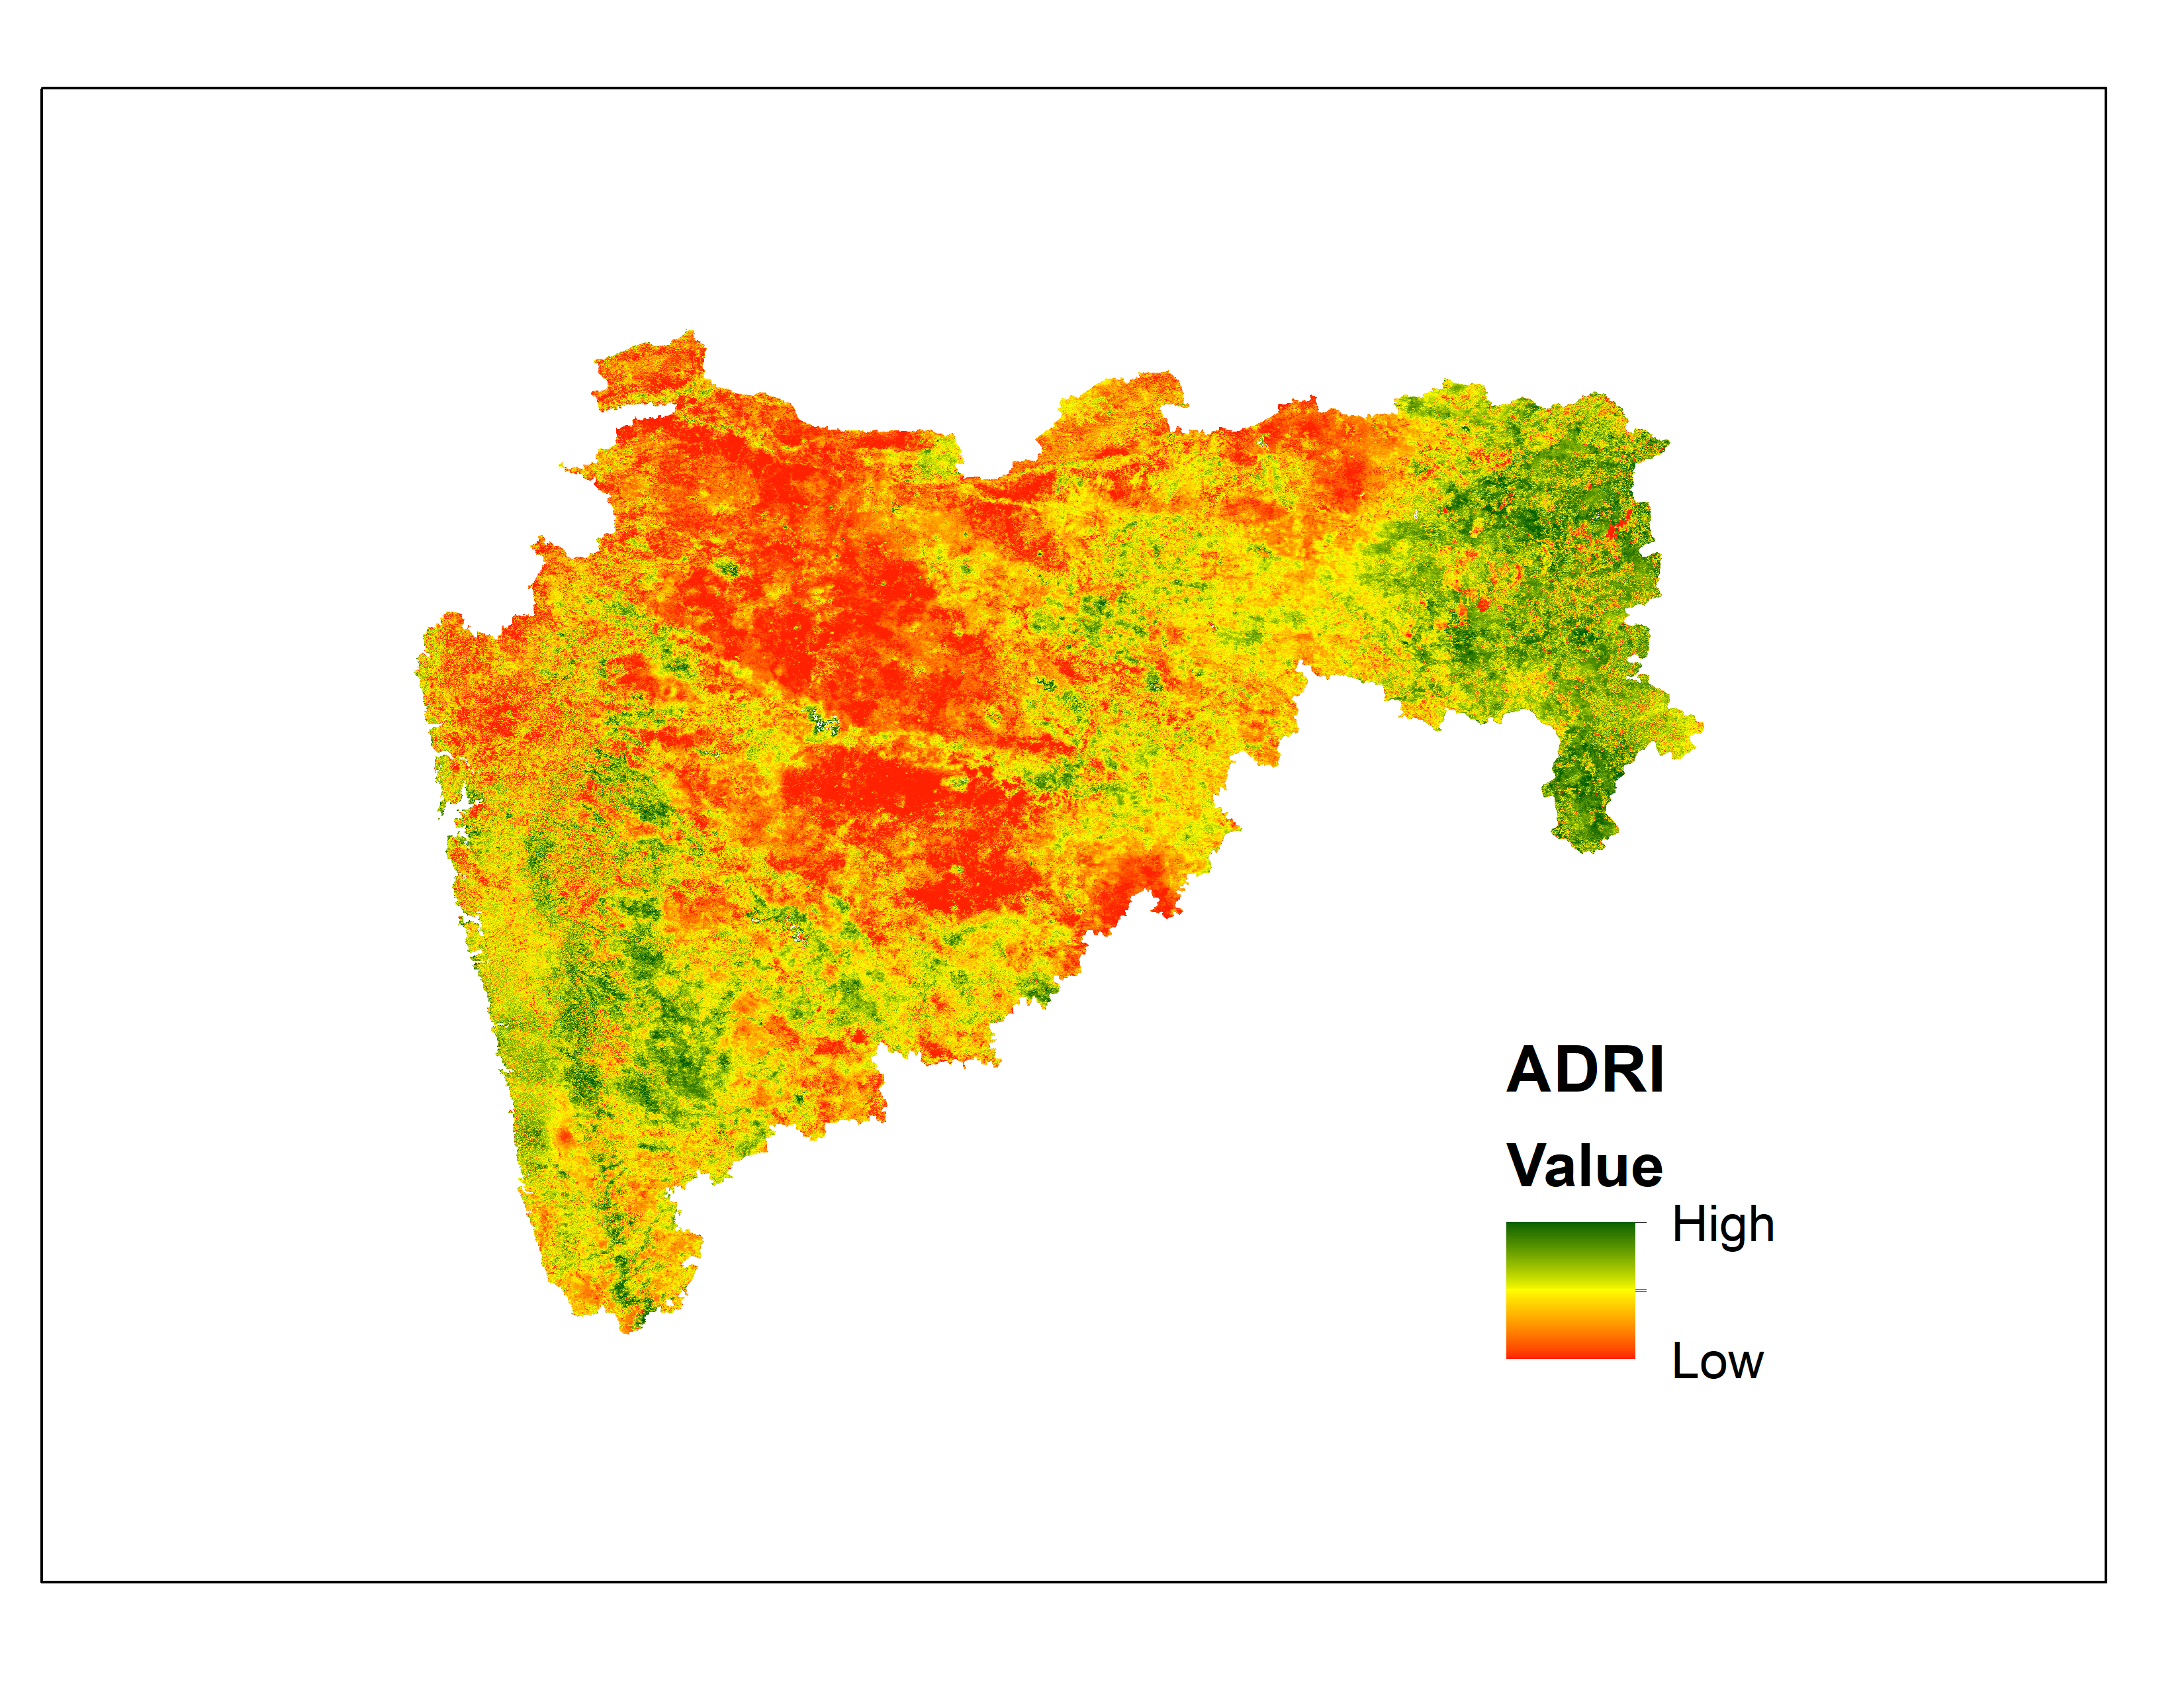
Advance Drought Response Index (ADRI)
 Where, ADRIijk, VCIijk, TCIijk, PCIijk and SCIijk are IDSI, VCI, TCI, PCI and SCI value for pixel i in composite j of year k.
The ADRI value ranges between 0 to 100; L is the normalization factor to keep the output value in expected range and c is a constant to avoid null in denominator.
The values close to 0 reveals extreme drought situation as vegetation is under stress, precipitation is very low and temperature is very high. Likewise, the values closer to 100 reveals normal situation as vegetation growth is good, precipitation is high and temperature is favourable.
Where, ADRIijk, VCIijk, TCIijk, PCIijk and SCIijk are IDSI, VCI, TCI, PCI and SCI value for pixel i in composite j of year k.
The ADRI value ranges between 0 to 100; L is the normalization factor to keep the output value in expected range and c is a constant to avoid null in denominator.
The values close to 0 reveals extreme drought situation as vegetation is under stress, precipitation is very low and temperature is very high. Likewise, the values closer to 100 reveals normal situation as vegetation growth is good, precipitation is high and temperature is favourable.